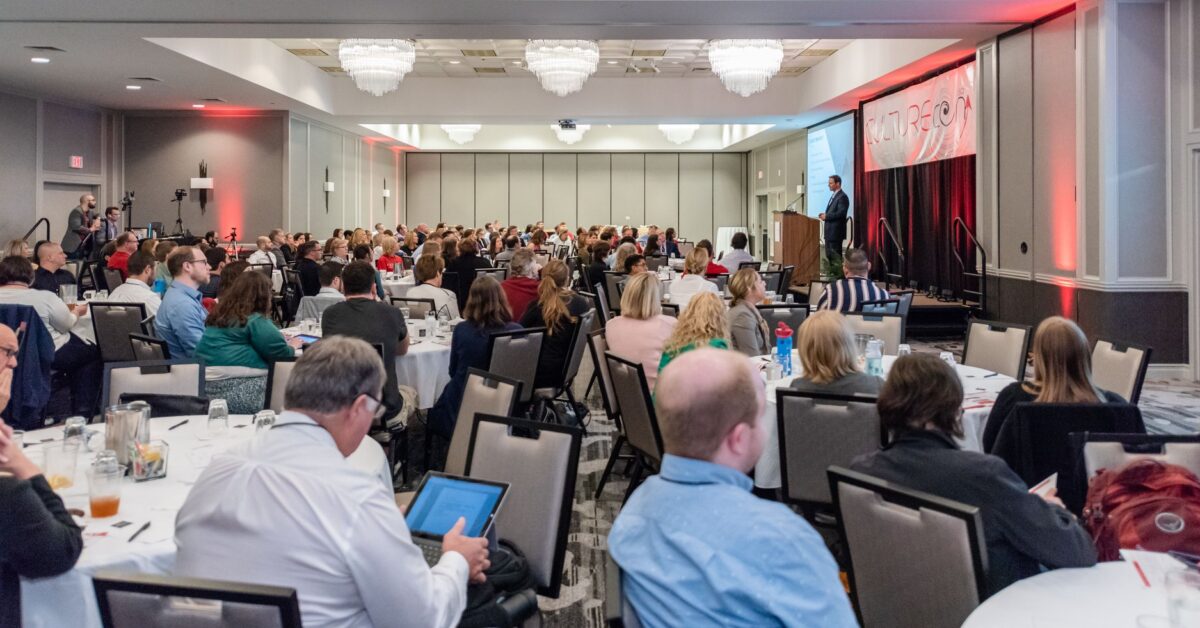
The marketing objective for the first annual CultureCon in 2018 was to target #CultureGeeks and generate brand awareness for the conference. In addition to that, we needed to drive registrations at a profitable cost-per-registration. In 2019, the second annual conference endeavored to increase both registration and profits with a reduced cost-per-registration.
Case Study: How paid media data analysis increased registrations by 87%

Case Study: How paid media data analysis increased registrations by 87%

The Client
CultureCon is an annual conference that celebrates positive organizational culture and features renowned speakers from across the globe. The first annual CultureCon conference took place in June of 2018 and continues today with conferences, virtual conferences, webinars, courses, and a strong online community network.
The Objective
The Challenge
In the fall of 2017, CultureCon was only a big idea fueled by passion for organizational culture. The founders bootstrapped their venture with the goal of providing value to their audience to help the workplace thrive. This presented two very large challenges. First, CultureCon was brand new, so we had to find the audience, reach the audience, and develop a measurement plan that would lay the groundwork for future events. Second, we were on a tight budget, so we had to make every penny count.
The Solution
We had to start from square one because CultureCon had no audiences, previous registration history, or account data. We created customer personas and developed identifiers such as interests, skills, groups, job titles, and organization size. This research led us to LinkedIn Ads, Facebook Ads, and Google Ads.
With no knowledge of what platform or audience type would perform best, we meticulously structured our campaigns in a way that allowed us to export data to compare platform, audience, and message side by side. During the last half of the campaign, we collected enough data to make decisions on top performers, allowing us to optimize and become profitable.
Our efforts in 2018 gave us a huge head start in 2019. Although we had plenty of data to analyze, we still needed to improve results. To achieve better results, we first analyzed the platform performance and allocated budgets accordingly. Additionally, we had had a more robust remarketing strategy due to 2018 registrations and more web and social traffic to work with which helped achieve better results. This allowed us to test a unique strategy to leverage each platform’s strengths, while limiting its weakness.
While prospecting performed better on LinkedIn compared to Facebook, remarketing was significantly cheaper on Facebook. Accordingly, we put the majority of our prospecting budget in LinkedIn prospecting audiences, while utilizing Facebook for the majority of our remarketing efforts. Google was used to remain present when prospects were searching for high intent keywords that indicated they were looking for conferences and learning experiences related to workplace culture.

The Results
The 2018 event was such a success because many of the targeting assumptions initially made based on customer personas successfully led to registrations. Some platforms and targeting variations performed better than others, which we were able to identify quickly and make the appropriate optimizations. Ultimately, we achieved more registrations than the founders expected at a cost-per-registration that was profitable.
In 2019, we had an even better idea on the role that each platform would play to help achieve registration growth. The budget allocation and the prospecting and marketing tactics on the various platforms led to decreased cost-per-click by 20%, which in turn meant we were able to generate more clicks for the ad spend.
It is important to note that we did increase the budget by 50%, but the decrease in cost-per-click increased efficiency and led to a 107% increase in clicks. Not only did we get significantly more clicks, but these were better clicks because they were more targeted and strategically placed within our funnel strategy. This ultimately led to an increase in registrations by 87% and a decrease in cost-per-registration by 12%.
Summary
Our campaigns were successful in year two because we played the long-game in year one. This case study is a perfect example of how you can structure your accounts to feed the necessary data to make smart future decisions. This paved the groundwork for continued testing and improvement that we achieved in 2020 and beyond.
Ready to discuss your goals?


